
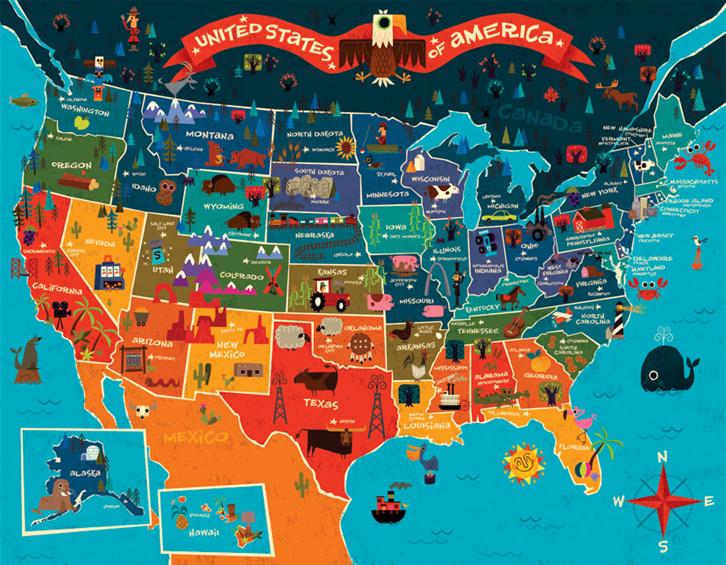
▲The map of U.S presented through inforgraphics: the features of each state was presented through different colors and illustrations, elevating the visual enjoyment.
What is Infographics?
Infographics is a compound word comprises of information and graphic. Basically it is a graphic, visual representation of specific information, message or knowledge. Examples of infographics range from maps, metro or bus maps, data graphs on the newspapers to various diagrams on Excel.
Originally infographics were used mostly on newspapers or magazins to illustrate the storyline or the plot of an incident. During 1970-90, the art editor of The Sunday Times, Peter Sullivan used substantial amount of infographics to draft and edit his writings and thus made infographics popular. After 2000, infographics evolved into animation or motion graphic which attracts even more attention. Nowadays you see infographics being applied on education, technology illustration, marketing strategy or news report. It is a great way of summarize long-winded and banal information and represent it in a clear, fresh and interesting way to the intended audience.
The World of Social Media
Mobile Technology
How to do Infographics?
Generally speaking, people usually read the graphs before the words. Applying this feature through infographics could improve comprehension and enhance the fun of reading. Of course, infographics suggest ‘a picture is worth a thousand words’ for it combines numbers, designs, colors and diagrams that contain information. Applying it in the design requires certain degree of experience and understanding of the concept. A clear and comprehensive infographics requires constant communication with the users and modification. The following principles are some guidelines for reference:
1. Effectively organize information: inforgraphics convey messages, and therefore it is most important that it conveys the organized message in a systematic and precise manner.
2. Express causality: when people view infographics, they need to be able to find causality through various visual elements.
3. Clear themes: an infographics can only solve on problem, it can’t cover everything and therefore the theme must be clear.
4. Use the color wisely: colors play an important role in infographics. People understand what it means through the contrast and the tones of the colors.
5. Combining design elements: combine layout, illustration, diagrams and signs etc, designers could make infographics become more attractive.
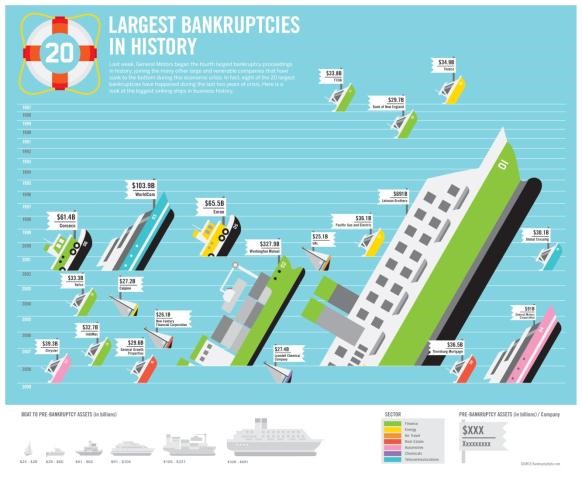
▲Largest bankruptcies in the history infographics: the size and category of the ships were used to suggest the scale of the banks; sinking ships is a metaphor for bankruptcy. The biggest among which was the Lehman Brothers’.
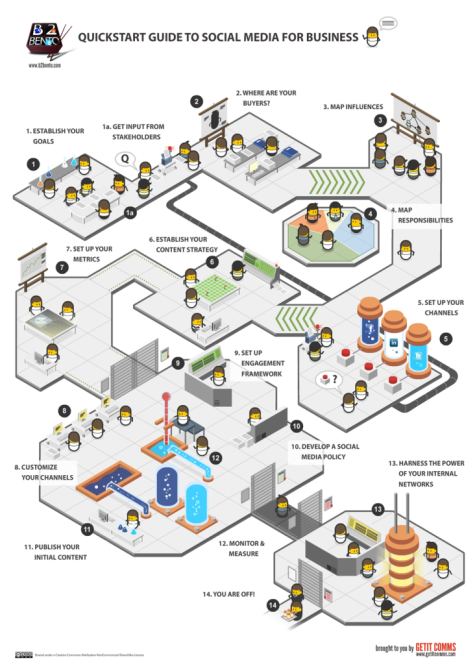
▲Using cute and interesting infographics to show process of how social media marketing works.

▲12 hand gestures you can’t randomly display overseas.
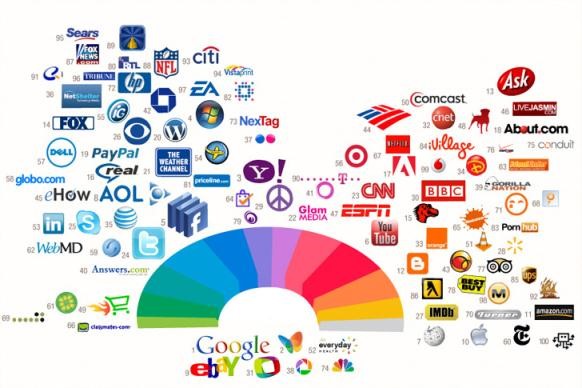
▲Most powerful web color: logos of different brands were arranged according to color range. This visual presentation is more comprehensive than words and carries a sense of design.
Why use Infographics?
The American company, Visual.ly specializes in infographics design. You could see from their launched golden formula: Story+Data+Design+Analysis that the field of infographics is very valuable.
What is Visual.ly?
Currently there are many companies that use infographics to introduce the concept of the companies or the services they provide. Presenting the products or services visually is a lot more effectively than words and phrases. Turning complex information into exciting and enriching graphs could help people understand the main points better and want to know more about the content behind the graphs. Finally, infographics (graphs or animation) is bound to become a trend and a good infographics could possibly replace powerpoint briefing in no time.
————————————————–
About Author
Gamania UI Designer Center/ Jason
Adopting a User-Center Design approach, the Center seeks to improve upon Group initiated projects to promote Gamania self-produced products and give the players the best user experience.
————————————————–